How Much Cents Per Mile Your Car Worth
Should I sink more money into this rusty piece of junk? Or just get a new car? Every car owner faces this question–and many others!—and must understand the true cost of car ownership to find the answer.
This article pulls data from automobile aggregation sites and government agencies to bring you a complete understanding of the cost of car ownership. It presents a comprehensive answer to "how much does a car cost?" using a cost per mile metric for easy comparison.
You'll walk away today being able to answer questions like:
- How should I compare time owned vs. miles driven?
- What's the full-life true cost of owning a car?
- How much does a car's value depreciate over time?
- How do I place value on the utility of my car (e.g. a work truck vs. a compact sedan)?
- When is a used car purchase smarter than a new car?
- How does leasing compare to owning?
- Should I sink more money into an old beater? Or just get a new car?

How to Compare Car Costs?
One of the challenges in finding the cost of car ownership is that certain car expenses compare like apples and oranges. As you read through today's article, make sure you understand the assumptions I make and how those assumptions affect the final verdicts.
How can we judge a grandma who drives to the grocery store once per week against the commuter who drive 100 miles a day? Those are two completely different use cases.
Similarly, how do we compare costs per mile (like gasoline costs and oil changes) against costs per time (like yearly registration and inspection)?
Thankfully, we have a lot of data to help answer these questions, and below are some useful conclusions that enable a single, consistent cost metric.
How Long Do People Own Their Car For?
The period of ownership is a key question to answer in this analysis.
50 years ago, the answer was around 12 years per vehicle. But with better market competition leading to better engineering, the average lifetime of cars today is around 15 years. (source)
Of course, this ties back to our previous comparison. Do we care more about the duration of car ownership or the distance that the vehicle has driven? The answer is both. Some expenses are tied to duration. Others to distance.
How Far Do People Drive?
Understanding the average distance a car travels is another key variable for today's analysis. Thankfully, we have a significant pool of data from the U.S. Department of Transportation's Federal Highway Administration.
The FHWA states that the average U.S. driver travels around 13,500 miles per year.
If we combine this yearly mileage statistic with the typical lifetime duration from above, we can calculate another important stat. The average car will travel approximately 13,500 miles per year for 15 years, totaling 202,500 total miles in its lifetime.
This aligns closely with AARP's longevity estimate of 200,000 miles.
Some cars will go further, others not as far. And we're also making a benign assumption that the yearly mileage of 13,500 and lifetime of 15 years are stable statistics.

202,500 total miles is a reasonable estimate for today's discussion, and we'll be using it throughout. Similarly, we'll be using the conversion of 13,500 per year to convert all metrics into dollars per mile. That's the metric of merit.
Breaking Down the Cost of Car Ownership
There are six significant costs when it comes to car ownership.
- Purchase/Depreciation cost
- Financing
- Maintenance and Repair
- Fuel
- Registration/Inspection
- Insurance
Let's break them down one by one.
Depreciation Costs
There are two ways to address the purchase cost of a car.
The first is to assume that the total base price of a car get spread like peanut butter over the entire life of a car. A $30,000 car that lives for 202,500 miles would cost 30,000/202,500 = 14.8 cents per mile of initial costs.
But the second way to address the purchase cost of the car is via depreciation. I think this method tells a more complete story.
Rather than spreading the cost evenly like peanut butter, the depreciation method examines the year-by-year decrease in a car's resale value. This argument assumes that a car is an asset insofar as it has a resale value.
On average, a new car depreciates by 11% the minute you drive it off the lot. It then depreciates by another 10% of the original value per year for the first five years (source).
For the average 15-year lifespan we've established today, the car would have to depreciate another 3.5% of its original value per year for the remaining six years to reach an eventual value of $1200 (e.g., the value of the car as scrap metal). An example of this depreciation is shown below.
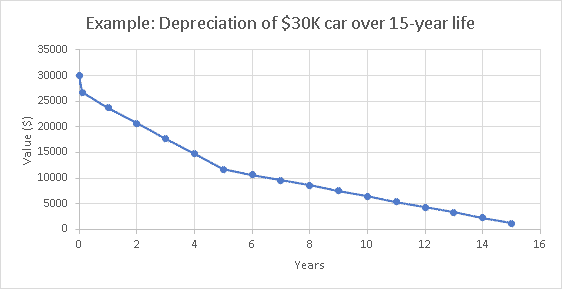
Year 1 sees 21% depreciation of the $30,000 value, or $6,300 of depreciation. If that is spread out over 13,500 of annual driving, that's 47 cents per mile! Much higher than the previous estimate of 14.8 cents per mile.
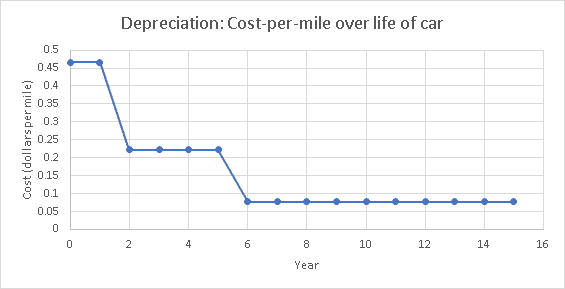
But if we look out at Year 10, we see a depreciation of $1050 over 13,500 miles, or 7.8 cents per mile. Depreciation hurts much more early in a car's life.
Financing
Note: I did not include financing in the original version of the article, but reader Ed B. convinced me too. Thanks Ed!
Financing is expensive! Depending on the duration and interest rate of your loan, you might be paying more than 10 cents per mile in financing costs. Avo id financing if you can!
Here are three different financing scenarios. You should be able to scale these data to your specific needs.
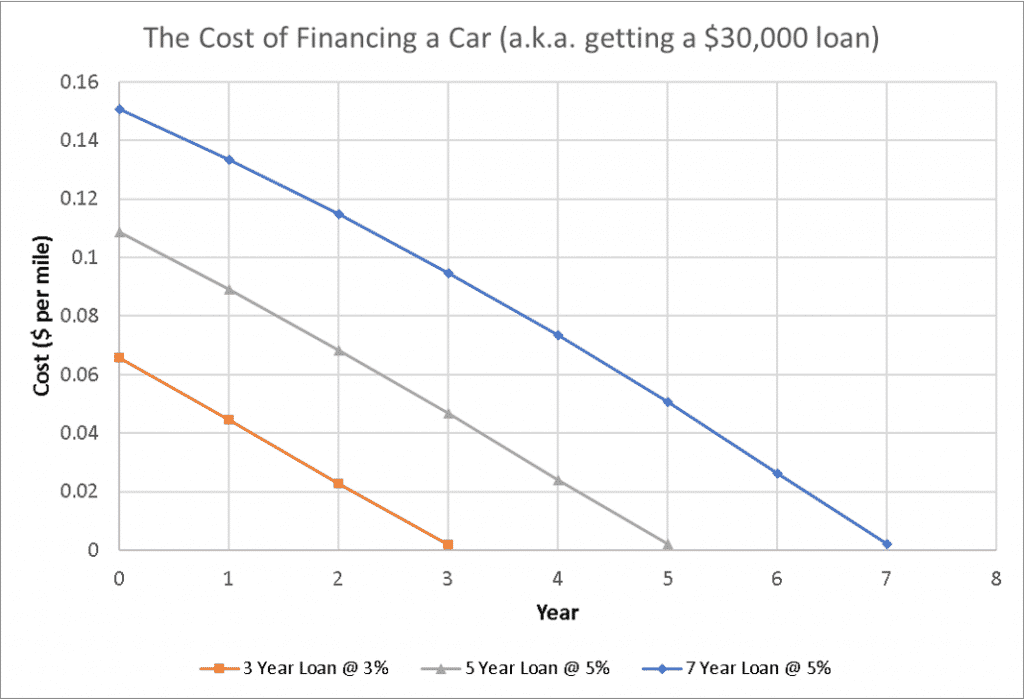
I do not include these numbers in my grand total below. Add them in there if you wish!
Maintenance and Repair
New tires, oil changes, or even new windshield wiper blades. Maintenance and repair are a drag on your wallet. And similar to depreciation, maintenance and repair costs change significantly over the life of a car.

First, most new cars come with a bumper-to-bumper warranty, covering most maintenance and repair. That typically lasts for 36,000 miles or about 2.7 years in today's analysis.
But these warranties typically exclude basic maintenance like oil changes. That's why some people consider purchasing an extended car warranty to allow more cushion for unexpected repairs and maintenance.
So for the first 36,000 miles, the maintenance costs are minimal. Let's assume $40 per oil change (every 5,000 miles in most cars) and another $50 per year to cover random odds and ends (e.g., new wiper blades). That adds up to about 1.2 cents per mile. But what about after those first few years?
Thankfully, the website Your Mechanic has a treasure trove of useful data on car repair frequencies over their lifetime. The data below shows their data converted to dollars per mile, including the initial low maintenance costs during the car's warranty phase.
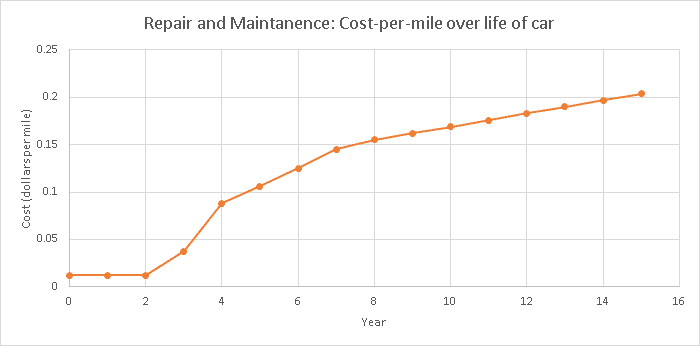
An old car costs more than twice as much as a new car (~21 cents per mile vs. 8 cents per mile). In general, maintenance and repair costs can be expected to increase linearly after the initial warranty period.
Fuel
According to the EPA, the average modern car gets 25.1 miles per gallon of gas. As of this writing, the average national gasoline cost is $2.16 per gallon. But we all know how gas prices can fluctuate. For the sake of round numbers, I'm going to use $2.50 per gallon of gas.
The math is now easy. If we drive 25.1 miles for every $2.50 we spend, then the average price of gas is 10 cents per mile.
We are also going to make the benign assumption that gas mileage does not change over a car's life.
Registration and Inspection
Registration and Inspection are two expenses that don't necessarily apply in all states. Each state has its own rules—some flat rate, weight-based, value-based, or even age-based.
I'm going to use the average of all costs and suggest you look up your own state's costs.
The average cost of registration is $54 per year, or 0.4 cents per mile.
Only about 2/3 of states require car inspections. In New York, for example, an inspection typically only costs $20 per year or 0.15 cents per mile.

Insurance
I surveyed a few different sources on the first few pages of Google. They all report the average yearly cost of full coverage car insurance in the $1300-$1600 range and minimum coverage in the $300-$700 range.
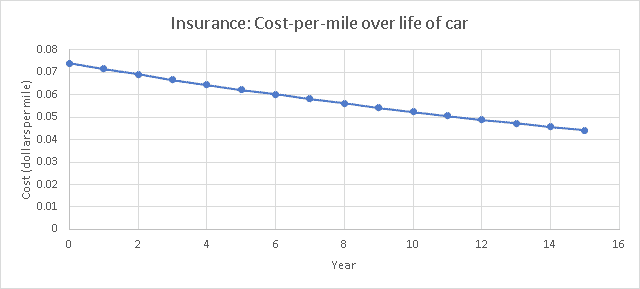
For the sake of today's analysis, I'm going to assume a middle-of-the-road (get it?) insurance package at $1000 per year, or $1000/13,500 miles = 7.4 cents per mile.

But do insurance rates change as a car ages? Yes! Car insurance rates drop by ~3.4% for every year your car ages. This is likely tied to depreciation. It's cheaper to replace an old car than a new car, and insurance companies account for that.
So our insurance costs will look like this.
Grand Total Cost of Car Ownership
The total cost of owning and operating the average car falls between 35 cents per mile and 65 cents per mile over the lifetime of the car.
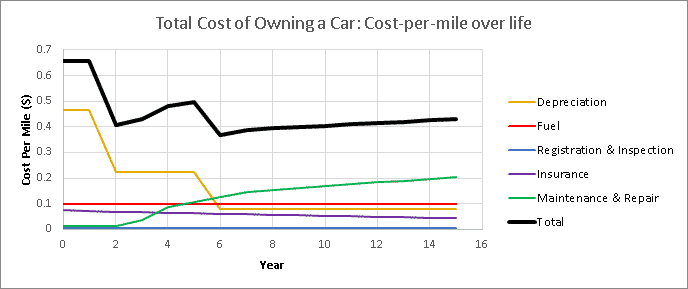
But the total plot is a little funky looking. Why the zigzags? Thankfully, the subplots illuminate where that funk comes from.
Initial driving costs are quite expensive due to the rapid depreciation of the vehicle. As the rate of depreciation stabilizes in Year 2, so do the driving costs. That is until the warranty expires—this causes the cost of driving to notch up.
Slow increasing maintenance and repair costs can then be seen in Years 3 through 6. Another notch occurs when the rate of depreciation decreases yet again. Years 6 through 15 are then marked by a slowly increasing maintenance cost and a slowly decreasing insurance cost.
P.S.—do you have maintenance, insurance, and fuel covered in your budget?
The Total Cost to Drive a $30,000 car is…
You math nerds might recognize that we can integrate the total dollars-per-mile plot over the life of the car to solve for the total cost of car ownership. For quick review, remember a few of our assumptions:
- The car costs $30,000 up front.
- We assumed an average life of 15 years and 202,500 miles.
- We assumed average depreciation and average expenses based on accredited data sources.
The total cost of car ownership is $91,200 over this average 15-year and 202,500-mile life, averaging 45.0 cents per mile.

Enjoying this article? Su bscribe below to get new articles emailed straight to your inbox
The U.S. Government's Thoughts on Cost of Car Ownership
Our estimate—45 cents per mile—lines up reasonably well with what the U.S. government thinks. The current mileage reimbursement rate in 2020 is 57.5 cents per mile. This suggests two useful conclusions.
First, it suggests that today's analysis has some merit. Perhaps my estimates are a bit low, or perhaps the U.S. mileage reimbursement rate is meant to cover average cars and more expensive cars.
And second, it suggests that you should not consider mileage reimbursement as any sort of "free money." The reimbursement rate is closely matched with the cost of car ownership—especially if you drive a vehicle with a higher sticker price or poor gas mileage.
Instead, think of mileage reimbursement as you would a tax refund. You're getting what's owed to you.
Cost of Car Ownership vs. Cost of Flying
We've established that driving is far from free. How does it compare to flying?
My home in Rochester is 400 miles from Boston and 330 miles from New York City. If I were to drive there (in non-COVID times), those round trips of 800 miles and 660 miles would cost me about $360 and $297, respectively, in car costs.
They also take ~12 hours and ~10 hours, respectively. We should also place a value on our time.
A $200 round-trip flight makes a lot more sense. Plus it saves you half a day in car.
But My Car Isn't Average!
Ever heard of this? When you design for average, you design for no one.
Let me present one more useful plot. Below, I've mapped out costs for three Ford cars: the economy-class Fiesta, the "average" Edge, and an F-250 truck with all the trappings.
The sticker prices on these three cars are $15,300 for the Fiesta, $30,000 for the Edge, and $59,000 for the F-250.
The Fiesta gets 36 miles per gallon, the Edge gets 26 m.p.g., and the F-250 about 16 m.p.g.
For the sake of building a true range, I assumed the Fiesta owner would get minimal insurance and forgo repairs when possible. I assumed the F-250 owner would get maximum insurance and spare no expense on caring for the truck.
This method doesn't cover every possibility, but provides a better range of potential costs than the previous average analysis.
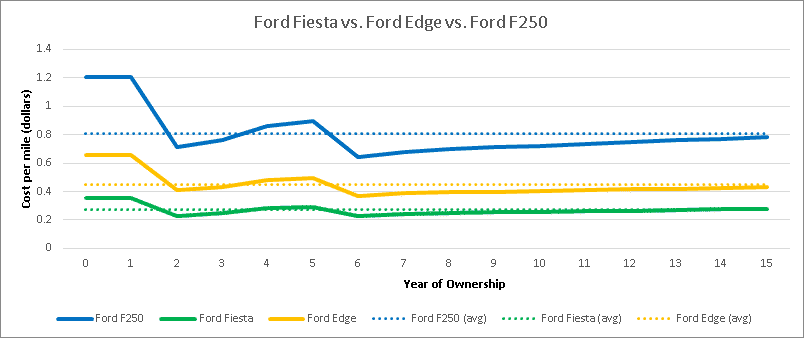
The Fiesta costs an average of 27.2 cents per mile. The Edge is basically average at 44.9 cents per mile. And the F-250 costs 80.6 cents per mile.
Over a 200,000 mile life, the Fiesta will cost $54,400 against the F-250's $161,200.
But an F-250 can do many things that a Fiesta can't. How do we monetize that factor? See "The Need For Utility" below.
But first, let's look at electric vehicles.
The Cost of Owning an Electric Vehicle
For this plot, I looked at a Tesla Model 3
- $38,000 sticker price, plus $2,000 to buy and install a home charging kit.
- Registration and insurance the same as a normal vehicle
- Fuel—this is an important one. Based on some quick Google searches and average U.S. electricity costs, a Model 3's "fuel" cost is about 3 cents per mile. Nice!
- And maintenance of electric vehicles costs about 75% of their gas counterparts.
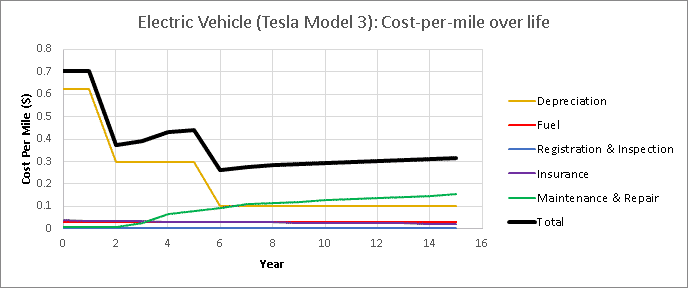
In the early years, the Tesla Model 3 is about ~8% more expensive than the average gas-powered car. The cheaper fuel does not make up for the higher sticker price.
But then, over time, the cheaper fuel and cheaper maintenance start making a significant difference. Whereas the average gas-powered car costs ~40 cents per mile in its later life, the Tesla Model 3 only costs about ~30 cents per mile. And that's significant!
While the total cost of the average gas-powered car is 45 cents per mile, the average cost of the Tesla Model 3 is 37 cents per mile.
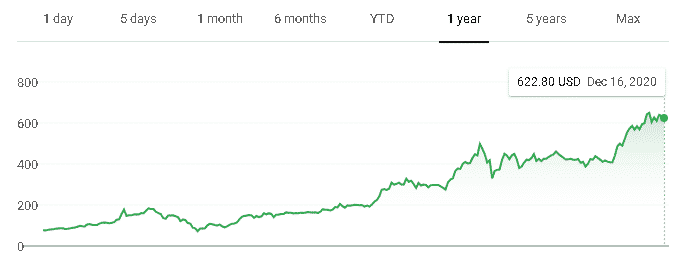
Maybe that explains Tesla's stock price?! 🙂
The Cheapest Car in America?
The following was written by Profit Greenly and published with that site's permission.
In 2021 the Mitsubishi Mirage is likely the cheapest new car for sale in America, though the Chevy Spark may sometimes edge it out. You can find it for around $11k—which is a seriously good deal.
But there may be another even cheaper car if you look hard.
With a $38,000 MSRP, the Chevy Bolt does not seem like a cheap car, but Chevy has been selling them in the mid-20K's for over a year now. After the reveal of the new 2022 model, many dealerships have marked their older 2020s down below $20,000!
This is still $9K more than a Mirage, but when you consider fuel and maintenance, things tip in the Bolt's favor. As noted above, Consumer Reports found that EVs had 75% lower maintenance costs than gas cars, but that was based largely on data from luxury Teslas and poorly-made 1st-generation Leafs.
They admit "current-generation EVs may be more reliable than many of the vehicles shown in the results," and this is likely true for the Bolt.
The Bolt's maintenance schedule is a hilariously scant three lines, one of which doesn't need to be done until 150,000 miles. The only maintenance most Bolts need is rotating tires, replacing the air filter and wiper fluid, and occasionally the 12V battery.
A small number need to replace their brakes, but this is generally due their brake calipers never actually cleaning the rotors off because their drivers use regeneration to stop 100% of the time. This can allow rust to build up and ruin the brakes. Bolt owners who do a good friction braking stop every month or so don't have this issue.
Conversely, the service schedule of the Mirage lists over 20 items, and Repair Pal estimates an average of $457 spent on maintenance each year. That's $6,855 over the 15-year life of the car.
The Bolt is too new to fully estimate its repair costs, but under $1K seems pretty likely so assume $6K in maintenance savings over the life of the car.
That means the Mirage still has a $3K lead, but what about fuel? The Mirage is rated at a combined 39 MPG, which means it'll burn 5,128 gallons of gas over its 200,000 mile life. If that gas costs $2.50 that will total to $12,820.
The Bolt on the other hand runs on electricity. The price of this varies widely based on where you live, but the average across the US was 12.8 cents per kWh in 2020.
In a state like Texas you can actually get a power plan with free nights and weekends and charge your EV for free then. This isn't an option in most states, but solar panels are.
Installing solar panels on an unshaded roof can lock in a power price of around 7 cents per kWh over the life of the Bolt (less if you DIY the installation).
A Bolt is rated at 259 miles of range from its 66 kWh pack, so it'll use 50,965 kWh over 200,000 miles. At the 12.8 cent US average this costs $6,523, a $6,300 savings vs. the Mirage's gas. Combine this with the $6k in maintenance savings and the net price of a Bolt is actually $3K lower than the Mirage!
If you installed solar and pay only 7 cents per kWh a Bolt's fuel costs drop to $3567 making the Bolt $6K cheaper in total. If you manage to find a free nights plan the Bolt could cost just $21K total over its life compared to over $30K for the Mirage.
And these lower total prices get you a car with more interior space and a 200 horsepower motor that achieves 60 MPH in 6.3 seconds vs. the punishingly slow 12 seconds for the Mirage's puny 76 HP motor.
There are a few caveats to the Bolt winning.
First, fossil fuel interests have lobbied a number of states into passing annual EV fees. These range from $50 to $225 per year, adding $750 to $3,375 to the price of a Bolt over its 15-year life. It'd be better if states just adopted a road damage fee, but I expect they'll just keep caving to big money lobbying and pass more EV-specific fees.
Second, one must realize that charging a Bolt on a road trip is both slow and expensive. The fastest the Bolt can charge is 90 miles in 30 minutes, and this is only under good conditions at modern chargers. Fast charging like this can also cost far more than at home, up to 41 cents per kWh.
You can certainly still drive a Bolt long distances. But if you want to go over 500 miles per day, I think the best bet is to rent another car for the trip (maybe a Tesla that can charge 5 times as fast).
We also haven't talked about the value of keeping money in the bank. If you keep the $9K you save buying a Mirage instead of a Bolt invested it can earn over $500/year. That will compound and close the gap between which car is truly the cheapest.
One way around this though is to find a low lease price for a Bolt. Right now a dealer in San Francisco is leasing Bolts for $19.95/month. I'm normally against leasing—and with this deal we must factor in the $2K down payment—but getting a car for just a few bucks more than a Netflix subscription is a hard deal to beat.
-Profit Greenly
Thanks Profit Greenly. Maybe I'll go get one of those $20 Bolts! What a deal!
The Need For "Utility"
Every driver will use their vehicles in their own way. This idea—each driver's unique utility—is a difficult cost/benefit analysis to quantify. But it's worth discussing. Here's an example:
How much value should a family of six place on a mini-van over a small sedan? The sedan is cheaper but cannot fit the entire family. The mini-van enables family trips and makes logistics simpler. There's some monetary value that should get placed on that, but how do we find that value? (I think I've found a way, discussed in the next section.)
Utility is a sliding scale. Let's consider the family of six once again. They might need to full seating of their mini-van on a weekly basis. It's a constant need. Similarly, a carpenter or contractor might need to utility of a pick-up truck for their daily work. But how often does a Jeep Wrangler owner require the utility of trekking across the savannah?
I'm cherry-picking a bit. People don't buy Jeep Wranglers only to take them off-road. But the frequency of utility of a vehicle is an important consideration.
Does it make sense to own a $40,000 vehicle where a $20,000 vehicle fulfills the same utility—e.g., only commuting to work? Of course not.
But does it make sense to purchase a $40,000 vehicle because it fulfills a daily utility that a $20,000 vehicle simply cannot fulfill? That's worth investigating.
Defining Utility Using "Value Over Replacement Car" (VORC)
There's a new-age sports statistic called value over replacement player, or VORP. In short, VORP objectively defines how good a player is compared to a replacement player of "freely available talent" level.
For example: if Lebron wasn't on the Lakers, they'd have to go hire the next best player not already on an NBA roster. How much better is Lebron than that guy? The answer is Lebron's VORP.
Similarly, I think we can define a value over replacement car, or VORC, to define how good (or bad) our vehicles' utility is. Let me give it a try.
Jimmy's Truck
Jimmy owns a truck that costs him $850 per month (per AAA) to operate. At 76 cents a mile, this lines up well with the F-250 analysis from above.
Jimmy needs the truck for the utility of towing his camper. He loves camping and takes ten single-weekend trips per year. But are ten weekends of utility worth owning a truck for? What is Jimmy's replacement scenario? What's the "freely available talent?"
One possible answer: Jimmy could buy the best value car for his day-to-day commuting needs and then rent a truck when he needs to tow his camper. By my estimation, Jimmy could get a Fiesta for about $300 per month. That would save him $550 per month, or $6600 per year.
But then Jimmy would need to replace the utility of his truck. How? There's "free available talent" out there precisely for this need: rental trucks.
A three-day truck rental for Jimmy's camping trips would cost about $400 per trip. Over 10 annual trips, this could cost Jimmy from $4000. Compared to his annual Fiesta savings of $6600, it seems Jimmy could net $2600 of savings per year.
Is the hassle of the rentals worth $2600 of savings per year? That's a subjective question for Jimmy.
Are there other factors I'm not considering? Probably. How about trips to the hardware store? A truck bed is a nice luxury for hauling lumber.
But at first blush, I'd say Jimmy's truck has a negative VORC (at least on the axis of utility). There is a significantly cheaper option that would provide Jimmy with the same exact utility.
When is a Used Car Smarter Than a New Car?
When is a used car smarter than a new car? Lots of people have pondered this question—with some good attempts at an answer. The total cost plot that we've established today makes it quite easy to answer. Thankfully, used cars are more trustworthy than they used to be.
To keep variables consistent, I'm going to look at a Subaru Outback. With a couple non-basic features, a new Outback sells for $30,000. That's the average price tag we used earlier. But now we want to see if buying used is a better than buying new.

A Real-Life Average Car
I found a used 2018 Subaru Outback with 40,500 miles—or 3 years of average mileage—selling for $23,000.
We're going to assume—rightly, I think—that all costs (except depreciation) associated with miles 40,500 to 202,500 cost the same whether the Outback has switched owners (i.e., is used) or not. On average, all cars are the same, and their cost of car ownership is the same. This is an important assumption.
Why exclude depreciation? The depreciation of a new car is based on that new car's price. But for this analysis, I'm going to assume that our used car depreciates from its used price ($23,000) to zero over its remaining life.
By my math, miles 40,500 through 202,500 for this Outback (reminder: it's an "average" car by this article's standards) cost $49,500. I simply looked at my total cost per mile chart from above, removed depreciation, and calculated from the beginning of Year 4 to the end of the car's life.
Next, I need to add the initial cost of the used car: $23,000. The grand total is $72,500.
New vs. Used: The Market Drives Efficiency
What do we get for this $72,500 total price tag? We'll be able to drive the car for 202,500 – 40,500 = 161,000 more miles. That means the used Subaru will cost $72,500/161,000 = 45.0 cents per mile. That's exactly the same as what we calculated for a new car!
Granted, each used car has its own story. How do you put a price on a car not smelling like the dog that used to ride in the back seat? Used products come with those kinds of questions. This is similar to the earlier utility discussion.

So, when is a used car smarter than a new car? Today's estimates provide a good starting point. Many used cars are priced such that the new vs. used argument is 50/50. The cost of car ownership is the same.
The market solves inefficiencies, and prices end up properly balanced. What a great example of Econ 101!
In your next car buying adventure, I recommend scaling today's average cost per mile data based on the make and model you're looking at, and then combining that info with the mileage and price tag of a specific used car.
I'd be happy to help if you're interested.
How Does Leasing Compare to Buying?
If you're not familiar, a car lease is like a long-term rental. You pay a regular monthly fee, but never actually own the car. You pay for gas and insurance, but not for maintenance and repairs (those are typically covered by the car's warranty). Lease agreements typically have an annual limit on mileage, too.
Let's examine an average lease and compare against the cost of car ownership. Since we've been using a Subaru Outback as an example of an "average" car, we'll continue that here.
I found a new Outback that would cost $29,900 new (essentially the same as my $30,000 original analysis) or would cost $372 per month to lease for 36 months. That's $13,392 of total cost to enable 40,500 miles of driving, or 33.1 cents per mile.
But that doesn't include fuel (10 cents per mile), insurance (7 cents per mile) or registration fees (0.55 cents per mile). Once we add those expenses, the leased car costs 50.6 cents per mile. That's 11% higher than the price of driving new or used (45.0 cents per mile).
Pros and Cons of Leasing
But there are some caveats.
If your leased car shows more wear-and-tear than normal (it's up to the dealer to determine that), you can be charged extra. Similarly, if you go over your mileage limit, you'll be charged anywhere from 10 to 20 cents per mile. These are two examples of rules that make leasing more restrictive than owning.
Not only is leasing more expensive, but it's also more restrictive. From a pure personal finance standpoint, is leasing worthwhile? Probably not.
But this brief analysis quantifies the difference for you. If you don't mind paying a 5 cent per mile premium (roughly $700 per year), leasing has some benefits.
Most significantly, in my opinion, leasing lowers your risk of catastrophic maintenance costs (e.g., reduces exposure to bad luck) and always puts you behind the wheel of a newer car. Some people don't want to be paying 40 cents per mile for their 13-year old car when they could be paying 50 cents per mile for a brand-new car. I get it!
Should I Sink More Money Into an Old Beater? Or Just Buy a New Car?
Should you make a $1000 repair on a car with 175,000 miles? This question requires a crystal ball to answer. It's tough. But it's important if we want a complete understanding of the cost of car ownership.
Thankfully, we have statistics and confidence intervals. The National Highway Traffic Safety Administration has a trove of excellent data in this department (see the "survivability equation" on page 6 of the document). This data is a bit old, for sure. But it's still useful.

How do you read this chart? Let's start with 1000 brand new passenger cars. After 7 years, you'd expect that about 90%—or 900 of them—would still be on the road. After 12 years total, only about 60% would remain on the road.
About 50% remain on the road after 13 years. But earlier, we assumed a 15-year average lifespan! This difference is because this survivability data is ~20 years old. Engineering has improved, and cars are lasting longer.
Using Survivability Data to Address Repairs on Old Cars
Let's say we are driving a 15-year old car, and our mechanic informs us it needs a new transmission—a $2500 fix, he says. Ouch.

We need a vital piece of information: how much further will this car drive before it ultimately dies?
If we only get 2500 miles out of it, the repair is an easy no—that would be $1.00 per mile for the repair alone. So how much further will the car drive? The survivability data helps us find an answer.
Below is a NHTSA survivability table starting in Year 15. The "Survivability" column shows the raw percentage of cars still on the road at a given age. The "Percent Died" column shows how many cars have died from Year 15 to the given year (e.g. 38.7% of 15-year old cars die before they hit age 17).
| Year of Ownership | Survivability | Percent "Died" Since Year 15 |
| 15 | 33.1% | 0% |
| 16 | 26.0% | 21.3% |
| 17 | 20.3% | 38.7% |
| 18 | 15.7% | 52.7% |
| 19 | 12.0% | 63.7% |
| 20 | 9.1% | 72.3% |
About half of all 15-year old cars get another three years of life. That's a median statistic (not the mean), but I still think it's good enough to use for our transmission question.
Is the $2500 Transmission Worth It?
Is a $2500 fix worthwhile if we get three more years of life afterward? Assigning our standard 13,500 miles per year, we get 40,500 miles of remaining life. This repair costs $2500/40,500 = 6.2 cents per mile.
We're already allocating 20.4 cents per mile for maintenance and repairs in a 15-year old car. Surely some of that expense is meant to cover things like this 6.2 cent per mile transmission fix?
But first, for the sake of conservatism, let's add that 6.2 cents per mile on top of all the other Year 15 costs—which total 43.1 cents per mile from our original analysis. That brings the total cost to 49.2 cents per mile for these last three years of the car's life. 49.2 cents per mile is greater than the average total cost of a new car—45.0 cents per mile. From this conservative view, the survivability data suggests that a $2500 repair on a 15-year old car is not the smart choice.
Let's next assume our maintenance and repair expenses do cover this transmission cost. That's grand! We're covered by definition, and the repair makes sense.
Middle Ground Analysis
Finally, let's think about the problem from the middle-ground. How much annual maintenance and repair would one have to make for scrapping the car to make sense?
At Year 15, our car costs 43.1 cents per mile to operate. And we've established that the average new car costs 45.0 cents over its lifetime. That gives us a margin of 1.9 cents per mile—that's how much cheaper the old car is compared to a new car.
We can allocate that margin entirely to maintenance and repairs, bringing the total maintenance and repairs allocation to 20.4 + 1.9 = 22.3 cents per mile. Over 13,500 annual miles, our maximum maintenance and repair allocation is $3010.
If you think your 15-year old car will be surpassing $3010 a year in maintenance and repairs, scrap it. Buying new is smarter.
In summary, the average 15-year old car will survive for another three years. And it makes sense to keep driving that car if maintenance and repair expenses can stay below $9000 total over those three years. A single $2500 transmission fix needs to be graded against that $9000 total.
Headed to the Junkyard: Final Thoughts on Cost of Car Ownership
Time to scrap this article! I hope you walk away with much greater understanding of the cost of car ownership. We covered:
- The total cost of car ownership
- Pricing our utility and "VORC"
- Government mileage reimbursement
- When it makes sense to take a flight
- Comparing used cars against new cars
- Comparing leased cars against new cars
- When to repair an old car
Was this article a Ferrari? Or a Pinto? I think understanding the cost to drive is pretty important. If you have feedback, I'd love to hear it. Drop a comment below before you hit the road.
Thank you for reading! If you enjoyed this article and want to read more, check out myArchive orSubscribeto get future articles emailed to your inbox.
-Jesse
P.S. – If you enjoy podcasts, check outthe Best Interest Podcast!
How Much Cents Per Mile Your Car Worth
Source: https://bestinterest.blog/cost-of-car-ownership/#:~:text=The%20total%20cost%20of%20owning,the%20lifetime%20of%20the%20car.
0 Response to "How Much Cents Per Mile Your Car Worth"
Post a Comment